Sunday, October 28, 2012

When tropical scales meets other scales: A global view of current Atlantic weather

The major news outlets lately have been completely focused on the threat of hurricane Sandy . Indeed, it has been rumored that it is one of the biggest threats to hit the Northeast [US] in years, and rightly so. The circulation pattern that is leading to this event is rare. It is comprised of a set of events on different scales, both tropical and extratropical, that is leading to this set of events.

The image below shows a hemispheric look of what's currently happening. The most prominent  feature are the two cyclones over the Atlantic ocean. The first one is obviously hurricane Sandy, the second is a not so different looking extratropical cyclone, which has been persisting for several days.


While these two low pressure patterns are quite obvious in satellite imagery, some other strong patterns are ocurring that are not as obvious in a picture.  The figure below shows the forecast of geopotential heighs (and anomalies) within the next couple of days. Geopotential heights are analogous to pressure.

The first and most most interesting pattern in the figure  is the major pattern localized over the Atlantic. Check out how the jet immediately shifts northward near the east coast of the USA. That red bullseye over northeast Canada is an anomalous ridge. That ridging pattern, flanked by two lows (seen above) is often called an "omega" pattern because of its resemblance to the greek capital omega.


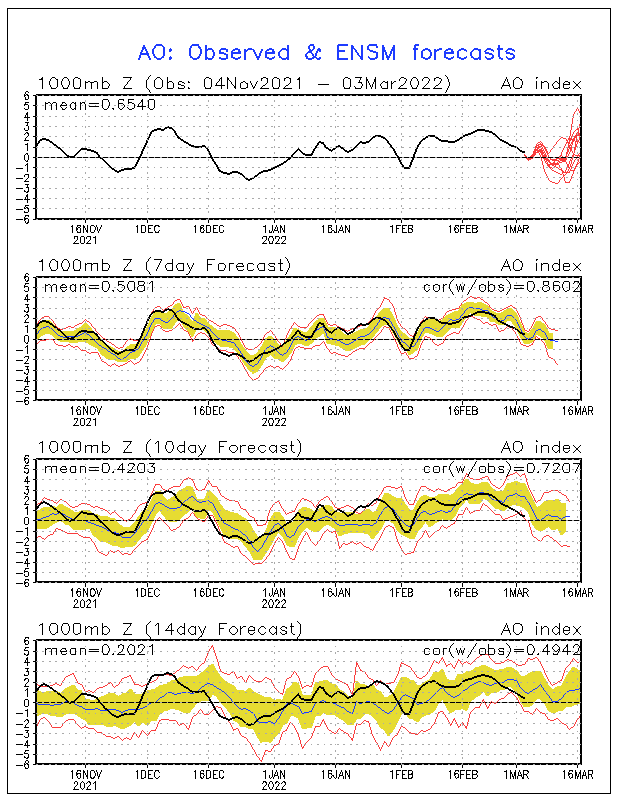
Indeed, we are currently in a period where the jet is weaker, and more wavelike features dominate weather patterns. This is very evident in the latest Arctic Oscillation (AO) Index, which has been negative for a while. A negative AO index indicates strong wave features, with potential for Arctic spills over the US, and anomalously warm Arctic temperatures. The pattern, however, is forecast to weaken in the following weeks, thus anomalous blocking patterns like the one seen above may become  less likely.


Thursday, September 13, 2012

Typhoon Sanba

Typhoon Sanba has become the object of attention lately, with its characteristic appearance of a robust tropical cyclones.  Below is an animation from NRL of the cyclone during the last couple of hours.


The cyclone strengthened rapidly while it passed an area of high ocean heat content, as seen below (image courtesy of CIMMS and RSMAS).  Although it has gained a lof of strength, reaching the Saffir-Simpson category 5 scale, it will likely not hold it for very long as it is leaving this area of high ocean heat toward one with cooler sea surface temperature.


As an additional sidenotem the cyclone is also dominating the upper-level divergence pattern in the form of velocity potential (divergence is the laplacian of velocity potential). In the plot below, yellow contours denote the velocity potential associated with large-scale upper level divergence, also associated with ascending motion. Green contours denote the opposite. Note the tight contours in the area where the storm lies.  The filled contours denote the upper level streamfunction. Tropical cyclones do not tend to project strongly in the rotation in the upper levels. The contours in that area are likely due to Rossby waves.
In a couple of days, Sanba might become a threat to some land areas in this region.We should keep close attention as this situation unfolds. 


Friday, January 6, 2012

About research money, outreach and people ...

Every once in a while I meet up with people I haven't seen in a while.  When you don't see people for a long time,  they seem to go through a similar routine of questions. Some of the questions include "What are you doing now?", "What's meteorology?" and the infamous "So meteorologists work with [insert something that's wrong but funny]?".  Last week I got asked if I worked with dinosaur bones! 

Sometimes you get thought-provoking questions, the ones that you keep thinking about long after the conversation is over.  For example, a couple of days ago I had another student ask me about funding. His questions were basically "How do you pay for school?", "Why are you getting this funding?" and "What is expected from you with this money. They look like pretty simple questions, and they are. The thing about them is that they make you think about the way that you are using your money,  what do you expect out of yourself, and so on. Naturally I told him about research assistantship, teaching assistantship and the many fellowship opportunities that are out there.  But then I started thinking "What do they want from me with that money?".

The fact is that they want you to do research with that money. Hopefully you will find interesting things, get some papers published, etc. All in all they just want you to add another drop to the cup of advancement of science. It is a topic that I keep mentioning in several blog posts.  In our field, one of the main goals is to improve weather prediction, so we can have better forecasts. 

Take for example what I do:  My research is focused on the MJO. While great progress has been made from it's discovery in the early 70's, there is still so much to get done.  It's complex behavior in the last couple of weeks has been discussed even among experts. All in all, we are still long ways to get a good grip over this big guy. 

It's erratic behavior has not been the only thing that's troublesome. Last year we had a good number of tropical cyclones that came to be, at least in part, due to the enhanced moisture and vorticity provided by the active MJO over the Indian Ocean/ Warm Pool region. Tropical cyclones Keila, Washi ,  Grant and Thane all were generated like this, to name a few.  Some of these storms caused significant damage to the areas they affected. In particular, Washi is responsible for more than a thousand deaths.

Images showing precipitation from TS Washi during the specified dates. The larger swath corresponds to TRMM's Microwave Imager (TMI)  while the smalle swath corresponds to the Precipitation Radar (PR).
These storms did plenty of damage, but what about other events. What about floods that come from prolonged rainfall, not associated with tropical cyclones. What about flash floods from convective precipitation? What about everything else that can be caused by anomalous weather. The truth is that we barely hear about these things. In fact, most people probably don't even know about the damage the tropical cyclones themselves did. The reality is that these events barely ever hit the headlines, and yet they happen on a year to year basis, claiming hundreds to thousands of lives. 

That's one of the reasons behind the heavy funding for research. If we could understand all this better, we could predict it better, hence reducing the likelihood of having a significant weather event claiming lives. But, is this really enough? The answer is inarguably no. 

There is a lot more to the safety of people than proper weather prediction. While it is great that nowadays we count with weather forecasts that are as easy to access as pressing your cellphone's button; it's pretty worthless is the reader has no idea how to interpret the forecast, even less if he/she doesn't know how to act to it. This is where outreaching comes into play.

Just as important as the science itself is spreading the knowledge to the public. But it is not something as simple as writing about it once and leaving it as is. It is a constant process. You have to let it be known with certain frequency, and be persistent about it. You also need enough facts and be convincing when you talk or else you might be shut down. It is a very difficult task. 

Back when I was in high school I was involved in a lot of community service. One of the things I got involved was doing a march against the abuse of elderlies. I directed the march and hundreds attended. It was one of the most fulfilling events of my life! In response to the march I got so much help from different people to help out with the, with people donating checks to wheelchairs. The next year I looked to follow up with a second march, or an event of similar magnitude. Because I was out of town for college I was unable to direct, so a new group emerged to make it happen. Communication between us was low, and the event never happen. That was it for the marches against elderly violence ...

Image from the march against elderly violence. 

That second march could have happened. It just needed more motivation, more persistence and the right attitude. This is what happens fairly often in many of lives situation, you bail on it thinking there's no solution when you can actually seek out an alternative. While this might be too simple with certain scenarios, like climate change, it is generally fairly true for many others. 

So are improvement and outreach all that we need? I don't think so. There's even more to all this than what I have mentioned. People's safety from weather, or other dangerous events depends just as much on each individual and the local government as it does on the other communities that work with it.  In the end it is a multifaceted task, which requires a drop of effort from many people. With the writing of this blog, I hope I do a little bit on the outreaching part. What about you?

Thank you for your time.

Ángel F. 


Saturday, December 31, 2011

[Res] Recapping the last active MJO

I want to start off this new year recapping the last 6-8 weeks of activity in the Indian Ocean area, where research is ongoing and activity has not even come close to ceasing. Just to show off how things have been, below is an visible image from Meteosat 7, provided by NRL. Here we see two active tropical cyclones: the now gone Cyclone Thane in the upper corner, and Cyclone Benilde in the lower portion of the image. 
Cyclone Thane in particular caused some significant damage to India's southeastern coast, uprooting several treen, causing power outages and claiming the lives of at least 42 people according to several news reports (Click here for some images of the aftermath of Thane). Below is a loop of IR images from Meteosat 7, showing the cyclones developing and moving westward, with Thane making landfall in the Indian coastline. 


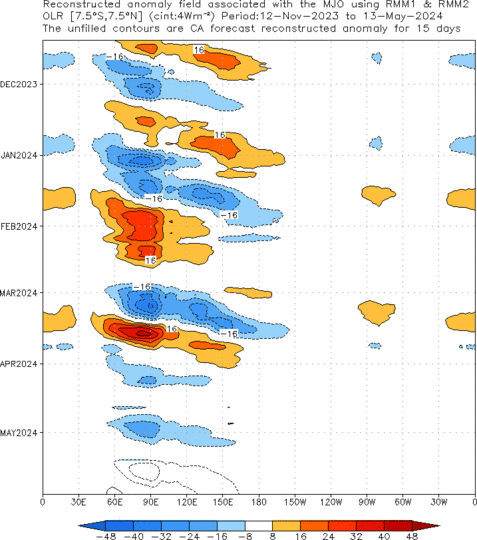
What is trully fascinating about these two cyclones is that their birth may largely be due to the rejuvenated (or newly formed) active MJO phase. In the image below, provided from NOAA's CPC, you can see the restart of OLR anomalies in the Maritime Continent sector. It's remarkable to see that, up to this moment, the anomalies associated with the MJO have had a similar pattern in OLR, particularly in their initiation part. I'm personally a little hesitant to say that this late December event is completely new, but from this picture, it almost looks like a new one started just further east than the other events. 


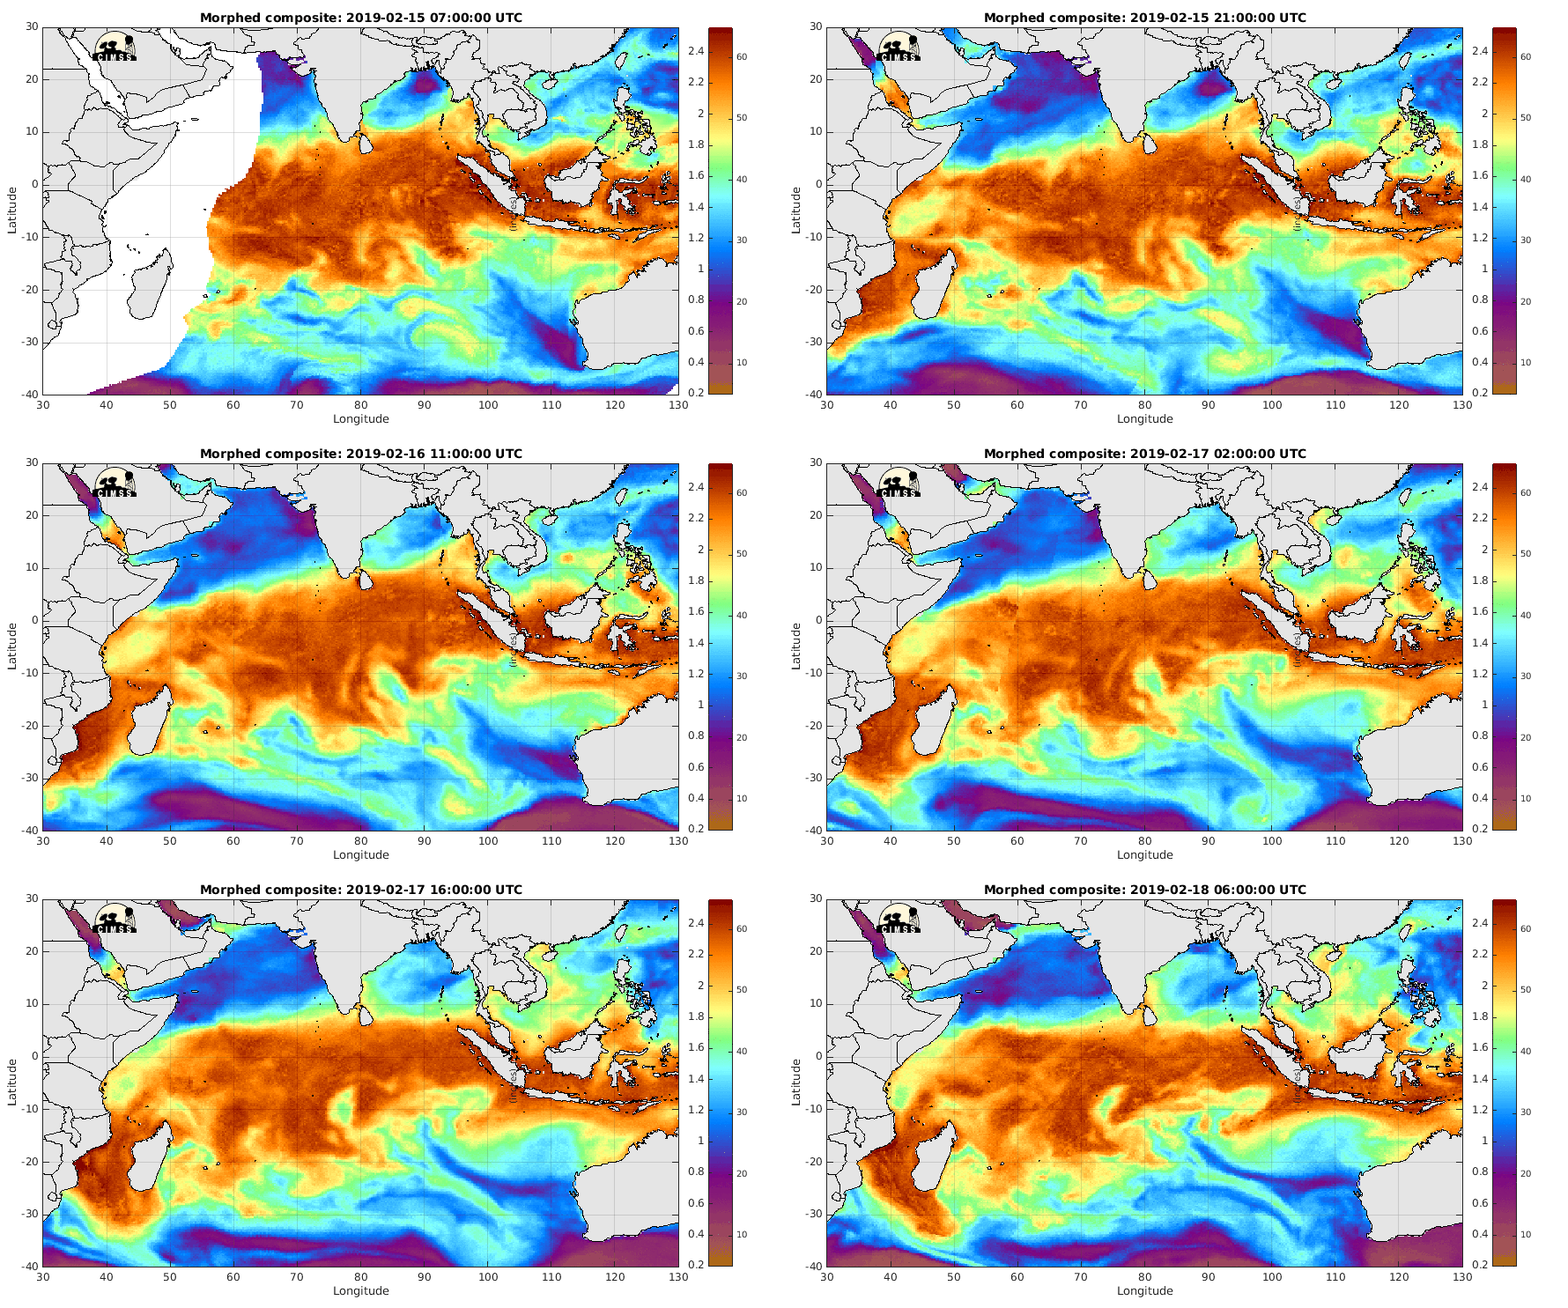
In the MIMIC-TWP loop below you can see both cyclones taking up moisture from the active MJO and from the apparent ITCZ in the southern Indian Ocean. It is also interesting to see some moisture from the remnants of Thane coming offshore on the western coast of India. Additionally, notice the dryer air mass creeping into the Maritime Continent.

The following loops shows a vertical cross section of moisture convergence over the Indian Ocean region for the last two months. When an MJO starts over the region convergence has much more vertical reach. Also, it seems to happen all over the region, making the method of initiation seem even more mysterious. 


The followig loop shows the 200 hPa moisture convergence and it's irrotational wind vectors for December 2011. Notice how when the December event strengthens, things start bubbling up in this region.  Overall things that makes one ponder about the dynamics of tropical instability

Wednesday, December 28, 2011

Nearing a close: 2011


I always love to make some sort of writing at the end of the year, mentioning some of the most memorable things. This year is no exception, it's been a special year. As 2010 marked a year of personal transformation, 2011 has been a year of continued growth.

In some ways it is also like every other year. You know, life has to go on, and it does every year. For me funny things have to happen to me every year, and this year was no exception. A few noteworthy things were:

1. I lost my keys and had broke into my own apartment.  I got in but still looked like a crook. I had some explaining to do to my neighbors after that!
2. Went snorkeling on the Florida Keys, got a cramp, everybody thought I was getting attacked by a shark.
3. Bought my 14th set of headphones (that I recall) since high school. This time I was smart enough to put a 2 year warranty on it. I finally learned!

Ok that's done with. Overall I feel like I have learned so much this year. I began research as a graduate student. That means that now I read scientific papers on a weekly basis. I am in no way near being an expert right now, but I have realized that there is just so much to learn in my field!!

Just look at the image below. Now normally one would just see the picture and say "Woah look at the clouds", or something like that. Nowadays I look at it and think "Wow that looks like complicated physics". You change like that. In a way you kinda become a little more insane, but not in a bad way.


In many ways I think this year by far has been two things. First of all I think it's been my most successful year professionally.  There is only one reason behind this: I just worked a little harder. I got my serious groove on and did an hour more of work per day. It has made a big difference. It doesn't mean I don't take breaks, I do, I am just better at organizing my time now (though I still get those moments in which I just sit on my exercise ball and do nothing).


Out of the things that 2011 has brought me, one is this obsession of constantly looking at what's going on in the Indian Ocean. A lot of the times it's kinda boring, but sometimes interesting things can brew, like on the loop below.


I guess that's just how it is sometimes. Just take the PhD comic below and substitute the question marks by the loop above, and you get my life on weekdays!


Well okay so maybe it's a little more than that. It's more like thinking about weather instruments, classes, research and donuts! Ok that's not true either! It's a pretty normal life actually, which is pretty much what I always wanted anyways.


Ok so I'm done with this post. Here's saying goodbye to what's probably been my happiest year so far (seriously). So it is with a little bit of sorrow that I say goodbye to it! Here's hoping for a great 2012!

Still merging science with wacky
Ángel F


Wednesday, December 21, 2011

Latest activity over the tropics

It's been a couple of days since I've posted an entry. Well, to be honest I am currently on Christmas break, so things have been going slow, especially since I am at home in PR. By no means this means that I am taking a break from everything!

The last couple of days have been fairly interesting in terms of tropical activity. The biggest story has been tropical storm Washi, which could become one of 2011's most deadly disasters, with the current death count nearing a thousand in southern Philippines. It has not been a major headline but it has been mentioned in several websites, like CNN, the Australian, Washington Post, and other sources.


The Moderate Resolution Imaging Spectroradiometer (MODIS), on NASA's Terra satellite was able to capture this visible image of the cyclone on December 16.  While not a particularly powerful storm, the combination of heavy rains and the island's terrain (topography, flora, agriculture) are likely the main cause of the deadly flash floods and landslides that claimed the lives of hundreds and left thousand of others homeless.


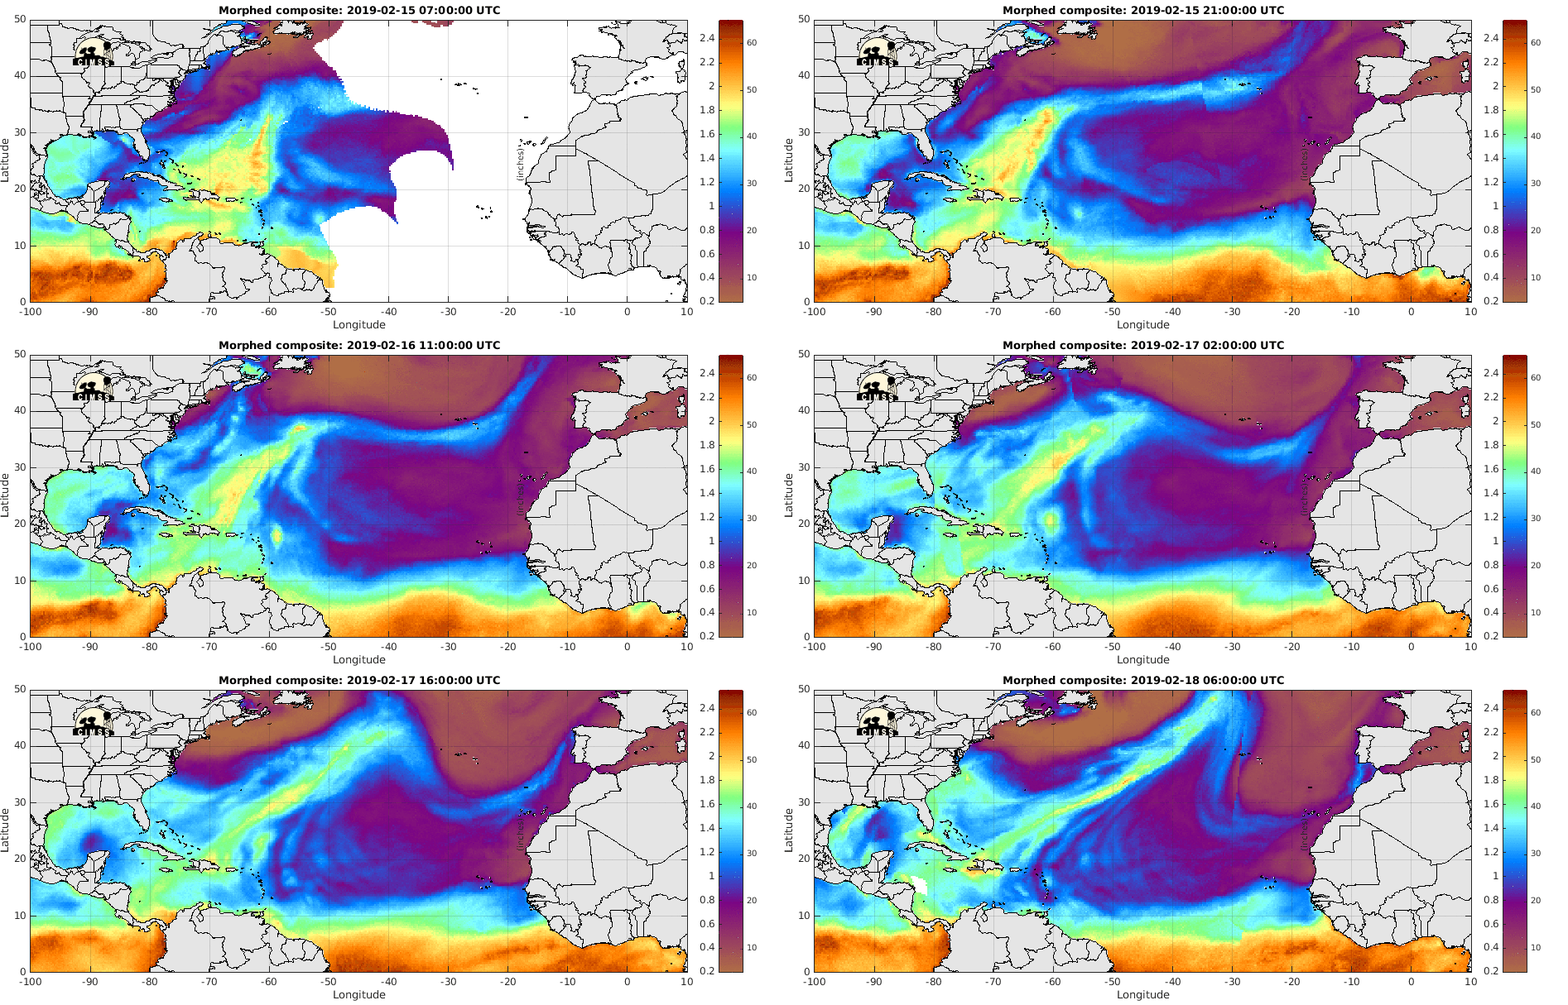
Elsewhere in the tropical region, some interesting activity has been occurring over the Caribbean region, as the remnants of a cold front affects the area (seen as the line of moisture moving southward in the CIMMS TPW loop) . While these cause great changes in temperatures in the continental U.S., here they're mostly known for modest changes and temperature and light rain. The NWS in San Juan, PR calls for a low to medium chance of showers during the next couple of days as more of these systems keep affecting the area. 


To put things in a clearer perspective, the North American Mesoscale Model (NAM), as well as other numerical models, continue to forecast several bands of these frontal systems to move into, and linger, over this region the next couple of days.

Forecast for sea level pressure (contours), precipitation (colors), and vorticity maxima (red crosses) from the NAM model. Image from UW's weather loops.
A global stiched IR image from NRL shows a resurgence of cold clouds in the Eastern Indian Ocean/Maritime Continent region as seen in the image below. Data from NOAA's Climate Prediction Center (CPC) suggest's that the MJO has restrengthened after stalling in that area.


A cross section of moisture convergence (from the 12 EST GFS analysis) over the Indian Ocean sector shows that, once again, convergence is considerably strong, even at mid levels, as can be seen in the image below. Vertical motion also has considerably increased.
Mosture convergence cross section
Perhaps more informative is a time series of moisture convergence going back in time to 700 hours.  The first maxima shown in the plot was in mid November, when the active phase entered the Indian Ocean region. Convergence rapidly declined as the area became dominated by the suppressed phase. It is worth mentioning that while the current moisture convergence values are not quite as high as before, they have been on the rise. I doubt they will reach values as high as they did before, since the MJO will likely propagate away from the area (or weaken), sometime in the next week or two.

Saturday, December 10, 2011

The tropics, my home, part 3: Beyond the clouds

Prepare for a long entry! And by the way, even though some I put links on the same names over and over, I may be putting new websites that might be of interest to the reader. 

On the last post from this series I wrote about a little bit about tropical clouds, rain, and how they influence our culture and lifestyles (with one last picture below). Today I will talk on what moves around these clouds, and give a story on things I’ve learned about the tropics through the years that have made it an even more interesting place to me!
The ñapa picture of a sunset behind some activity. Picture courtesy of Gian A. Villamil (Physics/Meteorology UPRM)
During the year 1995 we had a very active hurricane season. This was actually the first season I can recall almost completely (I was like 7 back then). Interestingly, this marked the beginning of as series of active seasons that’s still ongoing; largely attributed to the Atlantic MultidecadalOscillation (get used to oscillations, we like to name our phenomena the “Blah Blah” Oscillation, it’s that or the “Yata Yata” Mode or the “Some Guy’s” Wave).

So it was 1995.  It was late August/early September. It was near my birthday, and we had this approaching system. It developed from what we call African Easterly Waves , whose signature can often be traced in those westward moving cloud clusters. That benign looking cluster developed into monster truck of a hurricane, named Luis. That hurricane (by then a large category 4 in the Saffir-Simpson wind scale) started lurking in our area, and the media starting buzzing about it. Being a puertorrican myself, and knowing how we are, I give my good word that I am not exaggerating when I quote:

            “Every supermarket, grocery store and Walgreens was left barren.”

Hurricane Luis

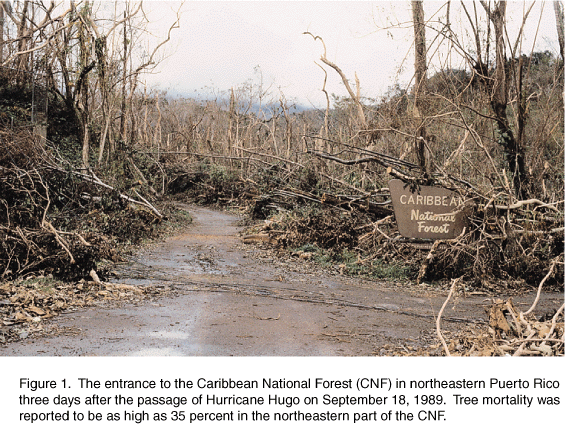
This was a big deal; it was the first hurricane since Hugo in 1989 slaughtered almost every leaf in El Yunque (it's even documented in a journal, pic below). Because of this it was understandable that people overreacted (although we overreact for every hurricane). I recall my dad putting metal and wooden bars in every window of our house, and considered taking down some of the trees in our backyard because of their potential danger to our house. In the end not much happened. Luis curved northward and we got spared. 
Image from the USGS report on Hugo's damage on the El Yunque region 
Later that year we got threatened by more systems, including a scrape from Marilyn.  The last one people talked about was Sebastien, which fizzled off without even getting close, so much for that one.

Hurricane Marilyn
Tropical cyclones are a special thing. In terms of atmospheric things they are not very common, with roughly about 90 tropical storms, and a fraction of that becoming strong enough to be called hurricanes, typhoons, etc. You need several conditions for them to develop,  and some more stuff for them to get big and strong. I like to think about most tropical phenomena as types of vehicles. In this sense, hurricanes are a sort of fancy car.  Compared to other vehicles, they are more powerful, beautiful and expensive. 

A fancy car.

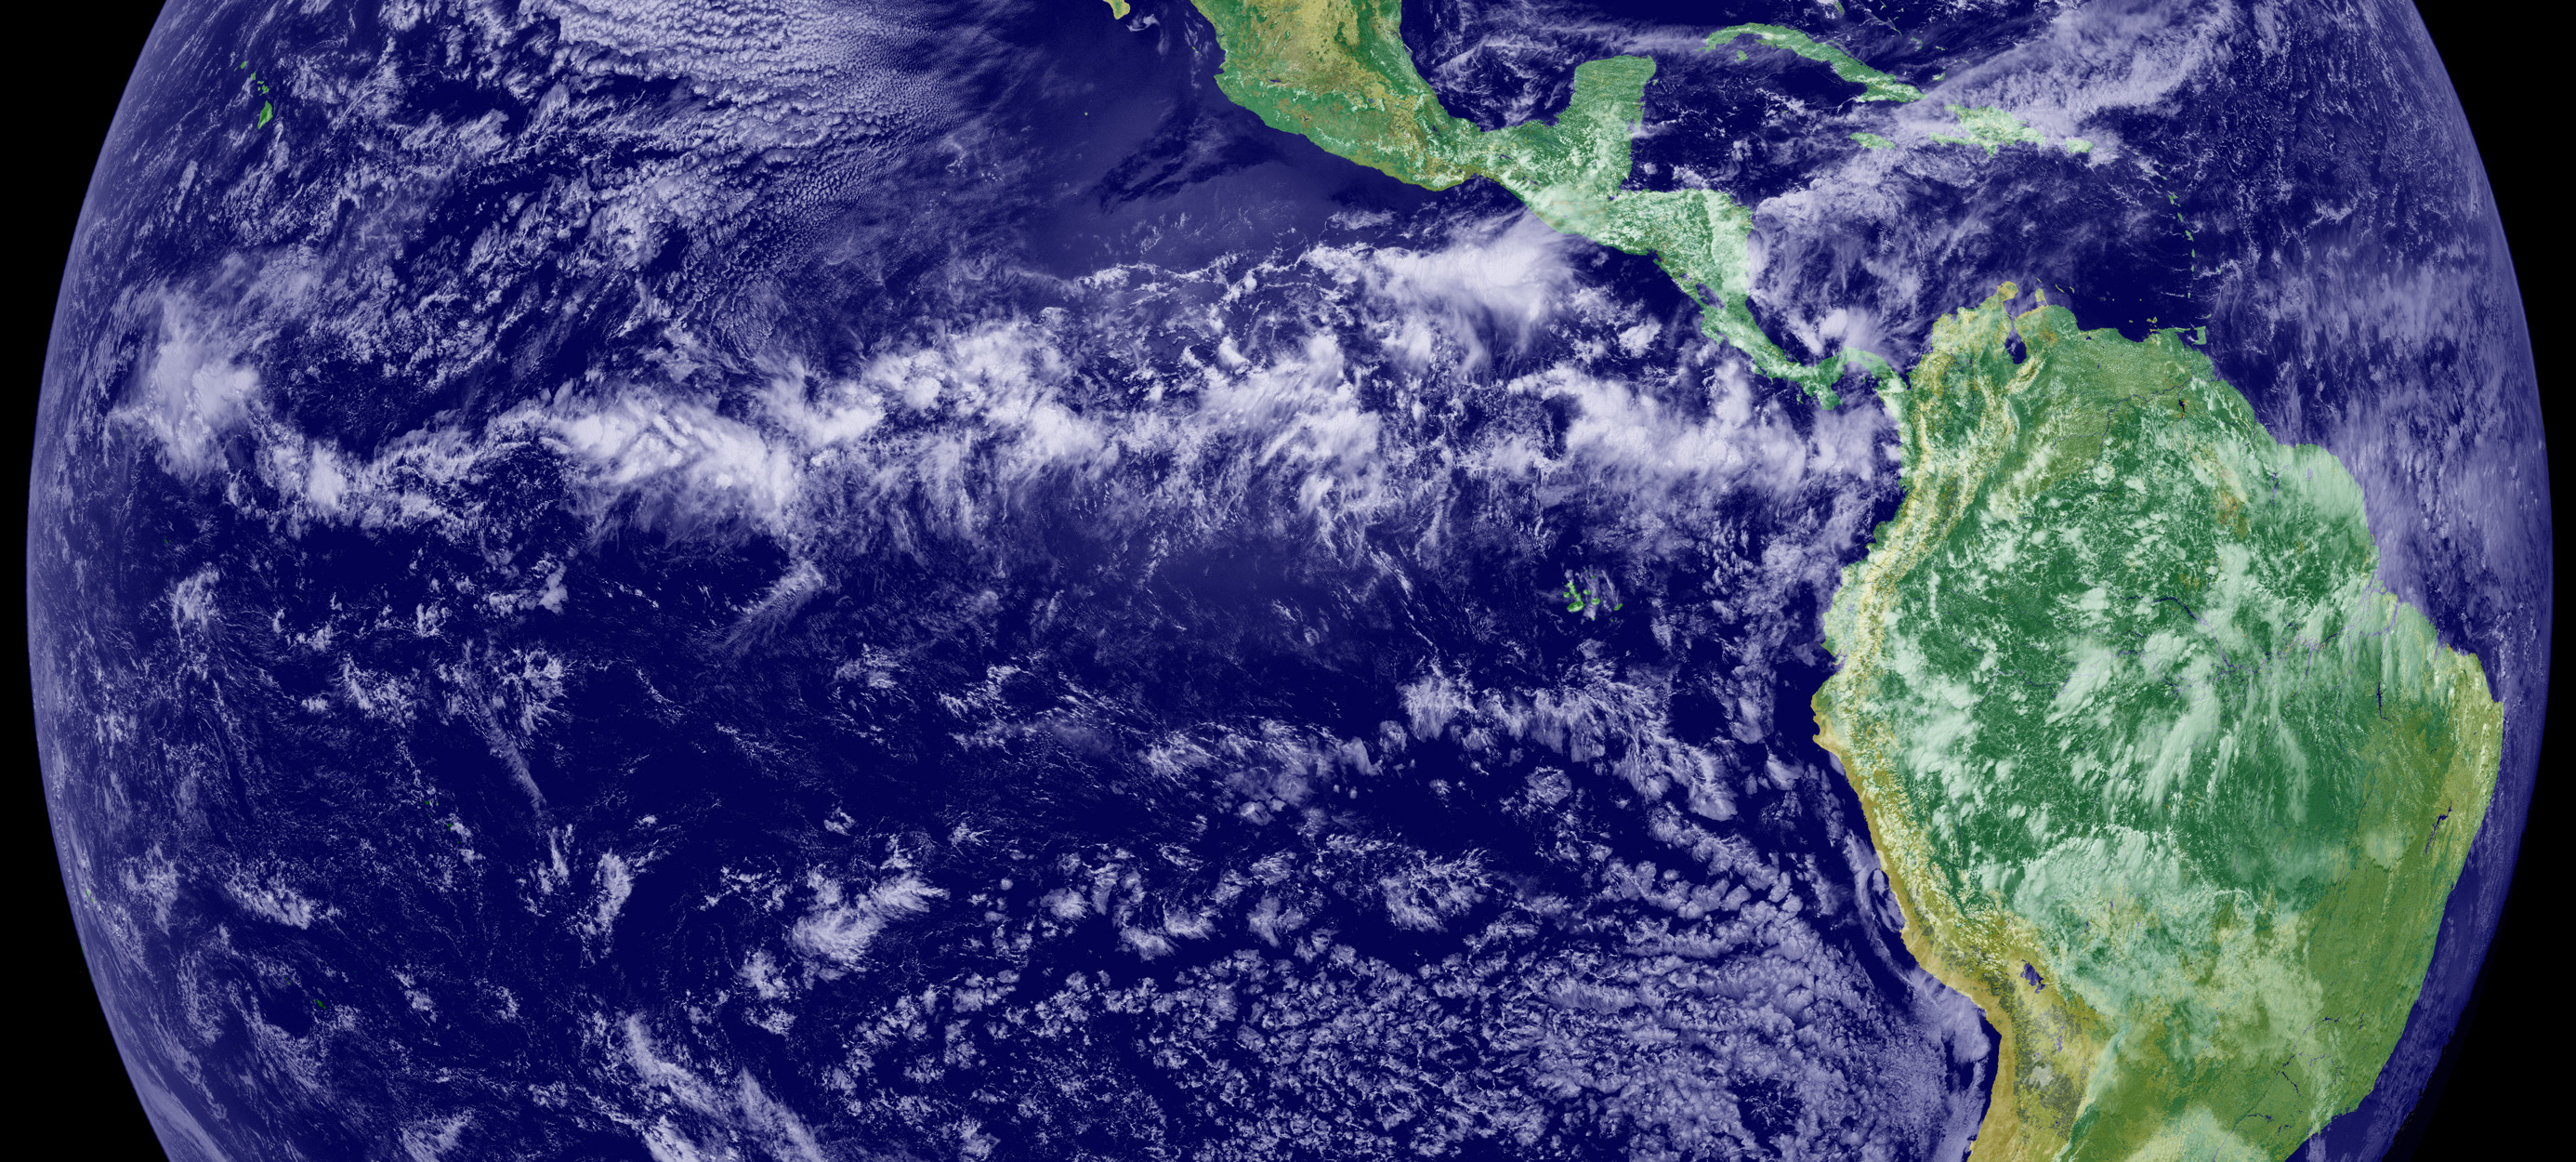
So, if hurricanes are fancy cars, then what are the other cars then? Well it so happens that the tropical atmosphere is full of waves and disturbances moving about. It can be to the east, or to the west, fast or slow. One particularly active place is the Intertropical Convergence Zone. This is one of the most energetic places on Earth, with giant clouds towering many kilometers up in the atmosphere.  This area is responsible for a good fraction of the planet’s rainfall. You can easily recognize the ITCZ by looking at a map of the planet and seeing this thin belt clouds close to the Equator. In a way, the ITCZ is like the tropics’ highway.


There are also some bigger things that like to move around. There is the behemoth I’ve been mentioning a lot in my entries called the Madden-Julian Oscillation. This guy is like a carrier truck, a big truck that can carry many other vehicles in it. They are pretty slow but tend to enjoy ruling the road. They are also not as common as cars and motorcycles.


Of course, I did not know of most of these things when I was a kid. All I knew back then were tropical waves, hurricanes and clouds, and I thought that was pretty awesome. I learned of these, more complicated things in college, particularly grad school. Learning about these things has made me realize how dynamic the sky I used to watch as a kid actually is, and how complex it is.  It is so complex that there are some phenomena that have been studied for decades by some of the world’s brightest people and there is still a lot to be understood about them.

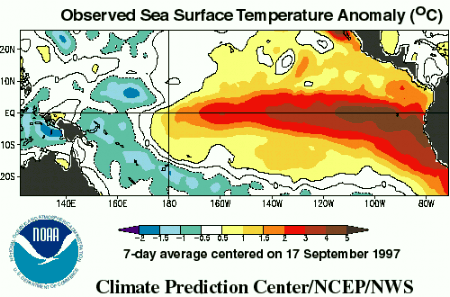
But that’s not the end of it. There are even more things going on. Ever heard of the El Niño Southern Oscillation (remember when I mentioned that we like to call everything an oscillation, there you go!). This is a coupled ocea-atmosphere phenomena that has implications all over the world. A particular case happened in 1997, which people call it the El Niño of the century. It was extremely strong, and its effects made constant headlines on the news (look at the animation of all the super typhoons that year).  It comes to show you just how something that happens in one place in the planet can affect everything. Like I said in a previous post, it really is just one Earth.


But why confine myself to where clouds form. Way up in the tropical stratosphere we have an interesting thing going on. It’s a shift in the winds that has the name of the Quasi-Biennial Oscillation (yet another oscillation!).

So there you have it, there are so many things going on it almost makes your brain explode.  The place I was born in and the place I’m currently dedicating my career to: the tropical atmosphere. I’m not alone in this, because there are conferences just dedicated to this topic in which hundreds attend. What can I say, it’s a pretty awesome place with huge clouds and beautiful beaches. What else can a guy ask for?