
If you want to read something basic (and funnier I guess) of this topic, stay tuned
to read the following chapters of my series "The Tropics, my home", which I will
continue updating soon!
Lately I've been hearing a lot of buzz on a phenomenon that we like to call the
Madden-Julian Oscillation (MJO), mainly because of an ongoing field campaign called
DYNAMO / AMIE where a lot of very smart people are trying to figure out why
this massive phenomenon happens and the why of its peculiar behavior. They have
field catalogs, constant observations and some of them are writing out their daily
experiences through a blog!
| DYNAMO Logo. It's pretty isn't it! |
Now to me this is a major event simply because this is the topic of my graduate research. If you do not know what the MJO is, and have some sort of interest in it, then the shortest, somewhat incomplete, definition I have for you is the following:
"It's a center of deep and stratiform convection (lots of big clouds) that is flanked by suppressed convection (lack of big clouds). It changes the speed and direction of the tropical wind field and propagates to the east slowly"
I think that's as simple as I can get it to be. The best way to make you get a feel for this thing is by showing a picture of it, so here it is

So why is that thing you see there of so much interest to the meteorology/climate community?? I can give you several reasons right off the bat!
1. The MJO is huge! You can have a cluster of clouds associated with this covering a large fraction of the tropics.
2. It modulates rainfall. In other words, that cluster of clouds in the picture can bring a ton of rain!
3. Also modulates hurricane activity in pretty much every basin.
4. We kind of don't know why it happens!
There you have it! Four good reasons why we would like to understand this thing! And good understanding means good forecasting! It's for the good of humanity (and the advancement of science)! Ok that might be a little of an exaggeration, but it keeps me motivated on days in which I just look at plots!
If you are not interested in the current state of this event and such stop right here and I will see you in my next blog!
So what's going on right now? We had an active MJO over the Indian Ocean during late October, and that phase should be right now over the eastern Pacific/Atlantic Ocean (see CPC's latest discussion ). It appears that a new active phase might be initiating in the Indian basin. We will see if it begins when the older phase completes the global circuit or not. Right now what's very apparent is a double Intertropical Convergence Zone, which has been mentioned several times now.
 |
| Latest Meteosat 7 IR image- obtained from NRL |
For comparison I am attaching the following plots of moisture convergence from the GFS analysis:
November 4
November 7
November 12
November 18
Latest Satellite Overlay
 |
| Moisture convergence from the GFS run. Vectors depict the corresponsing irrotational wind. |
November 1 (active phase near 90 degrees)
November 11
November 21
Now lets look at the satellite images and take a guess at what's going on. The latest raw winds
show good easterly flow nearly everywhere, except right at the equator, where we see some westerly flow. There is also some circulation going on on the area of strong convection. It looks like we may have some wave activity going on! Those westerly winds near the equator have been attributed to Kelvin Waves
 |
| 850 hPa Heights and wind vectors. Click here for a better resolution version (in pdf) |
If we decompose the wind field and just plot the non-divergent part we get a different story
 |
| 850 hPa nondivergent winds and vorticity. Click here for a pdf version |
Lastly, a 200 hPa height plot shows some curves in the heights in the southern hemisphere, possibly belonging to Rossby Waves. We are usually interested in watching these troughs and ridges moving around because of the possibility of momentum being fluxed into the tropics. This constitutes an important piece of one of the theories of MJO initiation.
 |
| 200 hPa winds and heights. Click here for a pdf version. |
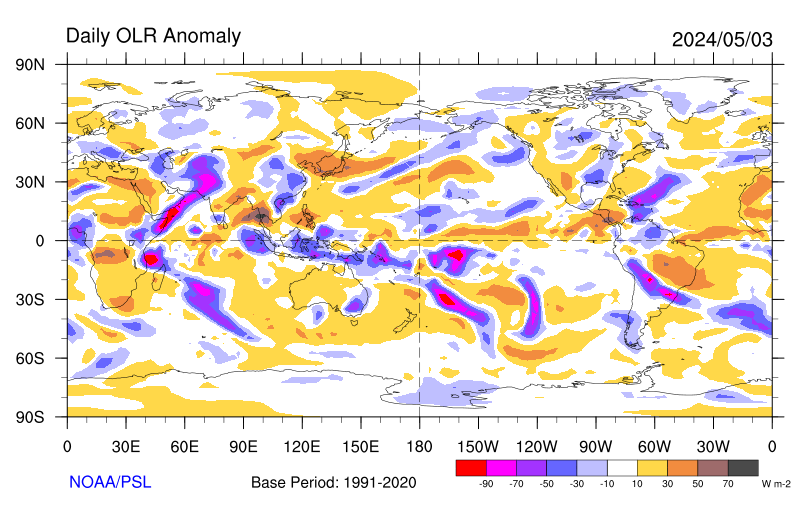 |
| Daily OLR anomalies from NOAA |
No comments:
Post a Comment